With Cyber Weekend 2019 upon us and leading into the chaos that is holiday shopping, we were interested in discovering the top stats and revelations from past years, and what that means for 2019, 2020 and beyond.
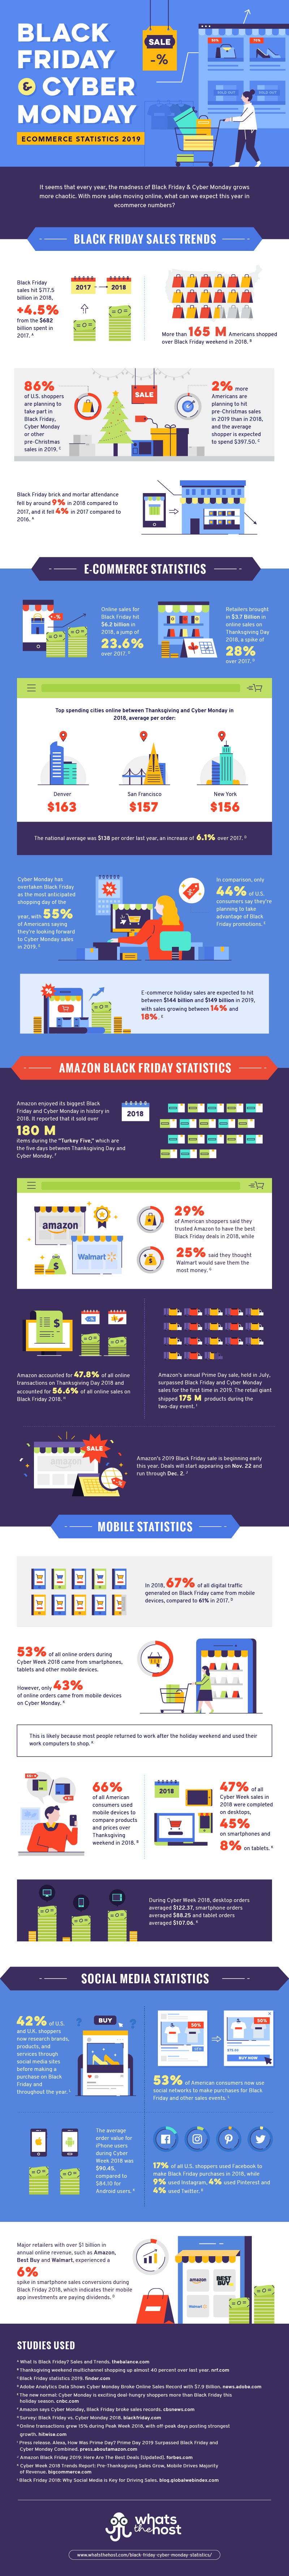
One of the main headlines is the decline of traditional retail and the explosion of ecommerce spending and sales. As proof of this, research from Adobe shows that Black Friday brick and mortar store visits dropped 9% last year, while ecommerce sales increased 23%. In 2018, $6.22 billion was spend on Black Friday, and more is expected in 2019. This is a clear indicator of which direction consumer spending is headed.
That’s not all there is to the story though, because while ecommerce is making impressive gains, we do have to keep these numbers in context, however, as overall Black Friday sales hit $717.5 billion in 2018, up 4.3% from the $682 billion spent in 2017. This is a huge amount, and ecommerce actually only makes up about $6.2 billion of that number.
Check out these stats and more in the infographic.
Thanks to web hosting and technology review site WhatsTheHost, who researched the most important Black Friday and Cyber Monday ecommerce statistics that you need to know this year, and visualized them in this infographic.