Prologue
Business Intelligence is comprised of an array of strategies & technologies that are often harnessed by the enterprises for analysis, interpretation & visualization of data. As the B2B dominion is expanding to amalgamate the interdisciplinary aspects of the digitized world like Search Engine Optimization (SEO), Digital Marketing, Growth Hacking & Content Syndication strategies all into its stride; BI tools have emerged as indispensable elements of B2B marketing.
In the words of Sherlock Holmes, "It is a capital mistake to theorize before one has data".
As stated by Solomon Negash & Paul Gray, business intelligence systems include:
- Data gathering
- Data Storage &
- Knowledge Management
Early in the year 1989, Howard Dresner, who later became an analyst for Gartner, defined business intelligence as an overarching "umbrella" covering the concepts & methods to improve business decision making by leveraging fact-based support systems. The usage of the "umbrella term" was popularized only in the 1990s when the term "business intelligence" got recognized and more widely accepted by the businesses.
When we think of the concept of intent signals being captured by the methods of data mining, for better targeting of the buyer personas, this can be possible only by leveraging automated marketing tools. BI tools allow marketers to assimilate the data generated through their omnichannel marketing endeavors. Using machine learning & AI algorithms, the data collected from omnichannel including the demographic, firmographic, technographic, psychographic, "fit-data" as well as data from historic, current & predictive views of business operations can be used for reporting, online analytical processing, data analysis, mining & processing. Complex event processing, management of business performance, using data for benchmarking trends, text analytics & mining, complex event processing & predictive & perspective analysis are the added advantages of using the BI tools.
With the expansion of digitization in all the spheres of B2B marketing, it is virtually impossible to think of as businesses devoid of data-driven decision making. Digital footprints left by the prospects on every digital marketing platform are tracked by the companies, coalescing which a holistic report can be generated to specifically design targeted campaigns for the prospects. The prospects can be divided into several segments based on their past purchase habits, research methodologies as well as their inclination towards the purchase or their extent of indulging on the website.
Business intelligence software can be categorized as application software designed to analyze, retrieve, transport & report data for Business Intelligence technologies. Business intelligence tools are aimed towards providing perspective, precognitive & to an extent implicit analytics from the researching habits of the customers & because they can handle large amounts of data they serve as excellent tools for identifying, developing & deriving meaningful insights from the big data.
Strategic business decision making by leveraging data into market segmentation & for niche specification helps the businesses in operating on a model for revenue optimization rather than scattering their efforts everywhere. Moreover, internal data from operations can be traced with the help of tools meant for website analytics. These data points can be compared against the data from omnichannel viz. those that have through an array of other channels such as social media platforms & other sources of referral traffic. Thus, an all-encompassing trend harnessed from the first & third-party intent data signals help the businesses in making better data-driven decisions. Market segmentation, prospect segmentation, k-means clustering analysis & development of a myriad of opportunities overarching the data-driven decision making are just a few advantages of the modern segment of BI tools.
According to Forester, the branches of Business Intelligence involve data reparation & usage.
Some elements of business intelligence which can be qualitatively & quantitatively measured by several business intelligence tools include the following:
- Multidimensional accumulation & distribution of data from omnichannel
- Using denormalization technic (applied on a previously normalized database to improve its readability by compromising on the writing performance by leveraging redundant data sets), tagging & standardization of data
- Real-time reporting with analytical alert and some preliminary precognitive/predictive text being displayed vis-à-vis the original datasets
- Interfacing with the unstructured data points
- Rolling forecasts after trend mapping over a while (at least a quarter)
- Coalescing inferences from the statistical interfaces & leveraging statistical methods such as ANOVA (Analysis of Variance), Multivariate Analysis & probabilistic estimation of the degrees of freedom allowed on deviations from the mean
- Defining the Key Performance Metrics (KPIs) on the immediate & long-term goals of an organization by delving into detailed trends of metrics over a while & working on with strategies of optimization of the business KPIs
- Employing strategic models for optimizing an attribution model for maximizing the sales endeavors
- Methods for version control & process management can be deployed with the help of BI tools. These include the methods such as P.E.R.T (Project Evaluation & Review Technic) as well as standard practices of Six sigma for test running & optimizing a process
- Moreover, data on open cloud-based platforms can also be managed securely with the help of the Business Intelligence (BI) tools
The topmost layers of the business intelligence market cover: reporting, analytics & dashboards. Basically, the standard BI tools must equip the marketers to derive meaningful insights from the data on hand with the help of in-built analytical tools, must allow marketers to report the data in the form of stories that convey meaningful insights as well as must provide multiple options for the visually appealing manifestations of data points in the form of interactive dashboards.
The application of Business Intelligence Tools assists the B2B marketers in data mining as well as data warehousing (which provides a subject-oriented & integrated system for reporting & analyzing data to aid the data-driven decision-making processes).
The deployment of Business Intelligence tools to help the purpose of data-driven decision making can be divided into the following main stages:
- Collection of data from multiple points across the internet viz. the omnichannel as well as from books, e-books, broachers & reports
- Presentation of data in the form of visually appealing pictographs or dashboards viz. a platform for visualization of data after integrating & storing data
- Interpretation of data with special mention of place & time
- Verification of data for its authenticity & to check for ambiguities, if any
- Distribution of data, &
- Actions of propagating the idea of utilizing media channels & taking the aptest steps for ensuring the security of data
Types of Business Intelligence Tools
Business intelligence tools comprise of the application software which is designed to retrieve, analyze, transform & report data from omnichannel marketing endeavors. The applications process data which may or may not be in a data warehouse.
Some of the popular Business Intelligence tools are as follows:
1) SAS:
SAS Institute (or SAS, pronounced "sass") is a multinational company based in Cary, North Carolina that develops & markets the analytical software, also called SAS.
The key features of the tool are as follows:
- It helps to access, manage, analyze & report data to drive the data-driven decision-making process
- SAS is the largest privately owned software company across the globe & they develop, support & market the suite of analytics software called statistical analytics system (SAS) – to capture, store, modify, analyze as well as present data
- Most of the Fortune 500 companies across the globe use the SAS (statistical analysis system) & it is a propriety tool well-known for making the right pieces of information accessible to the right set of people, at the right time
- The software included a Base SAS component that performs analytical functions along with more than 200 addendum modules for graphics, spreadsheets or other features
- SAS is known for special impetus on subscription models including support & updates, rather than providing the subscribers with a licensing option & holds the largest market share in the advanced analytics segment
- It provides a high-quality connection between various data points to help improve the users' experiences (UX)
- It assists in the protection of business data by identifying the security issues & resolving them
- It supports centralized metadata, governance, & scalability along with data visualization
- It facilitates platform service reporting for the end-users & provides the real-time analysis of data
2) Birst:

Birst is the next-generation platform for enterprise BI & analytics. The tool connects the entire organization through a network of intertwined virtualized BI platforms that are developed on a common analytical fabric.
The key features of the tool are as under:
- The tool delivers the speed, self-service & agility that is required for the front-line business enterprises
- It scales up security & keeps up to the rigorous standards of corporate data
- The public, as well as private cloud configurations offered by Birst, are extremely affordable for the enterprises & the Total Cost of Ownership (TCO) is often pretty reasonable
- The free proprietary SAAS platform performs the task of data discovery, analysis as well as reporting
- The platform is simple to use & automates data warehousing & also facilitates the integration of data from multiple systems
- The tool provides features for report generation & point-and-click analytics
- The tool works much faster than the contemporary BI tools & allows faster decision making
- Hassle-free & high concurrency analytics is possible because of Hadoop data architecture
3) SAP BusinessObjects Business Intelligence suite:
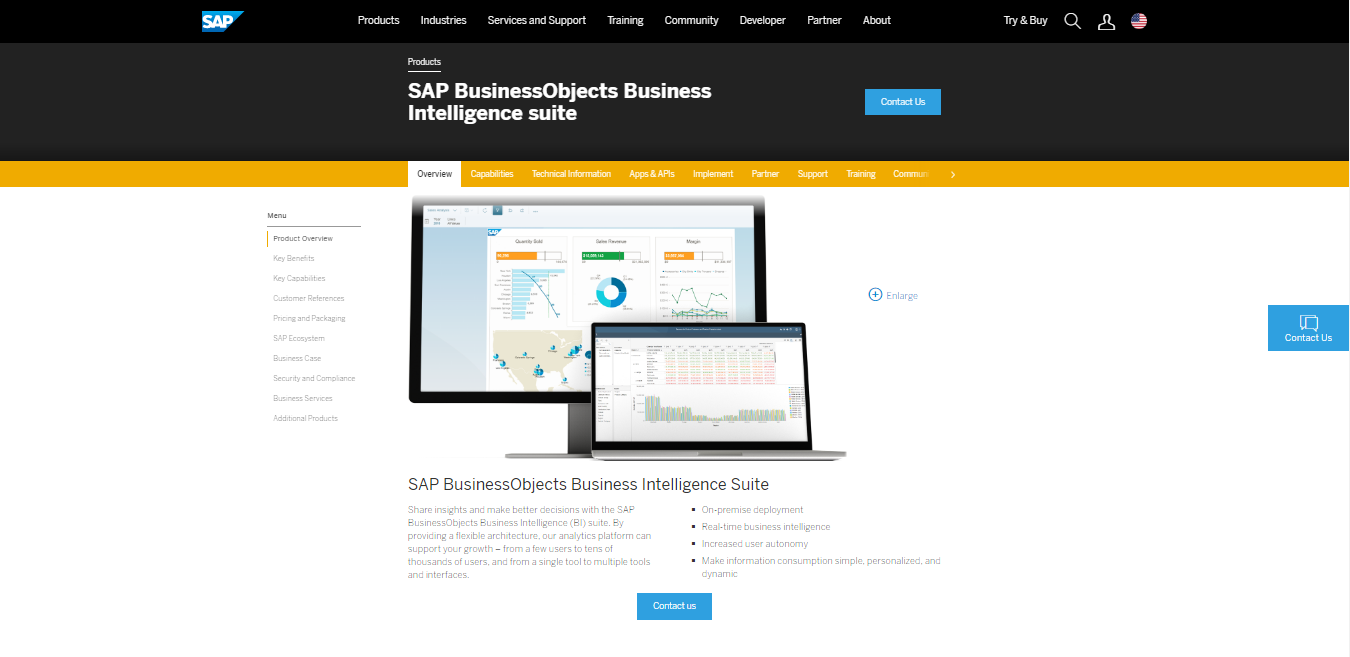
This tool provides a single, centralized platform for reporting & visualization of data. SAP BusinessObjects Business Intelligence Suite allows the enterprises to share insights & make better data-driven decisions using the BI suite of the tool. The tool also provides a flexible architecture to support the growth of the enterprises in terms of multiplying the customer acquisition process.
Some of the key features of the tool are as under:
- It a proprietary BI platform used for sharing BI information throughout an organization i.e. on-premise deployment
- It not only facilitates the business-user autonomy by allowing a large number of users a platform for accessing business data but also allows them to use insights from real-time business intelligence
- It simplifies the information to make it easily digestible by the users to driver quicker data-driven-decision making process
- It allows optimization of several IT resources & provides a common platform for the integration of the marketing, sales & It teams
- With increased user autonomy it facilitates faster deployment of resources
- It not only makes the reporting of data more impactful by including personalization but also makes it dynamic by allowing the real-time analytics of data – thereby reducing workload & increasing responsiveness & receptivity towards the data-driven-decision-making process
4) WebFocus:
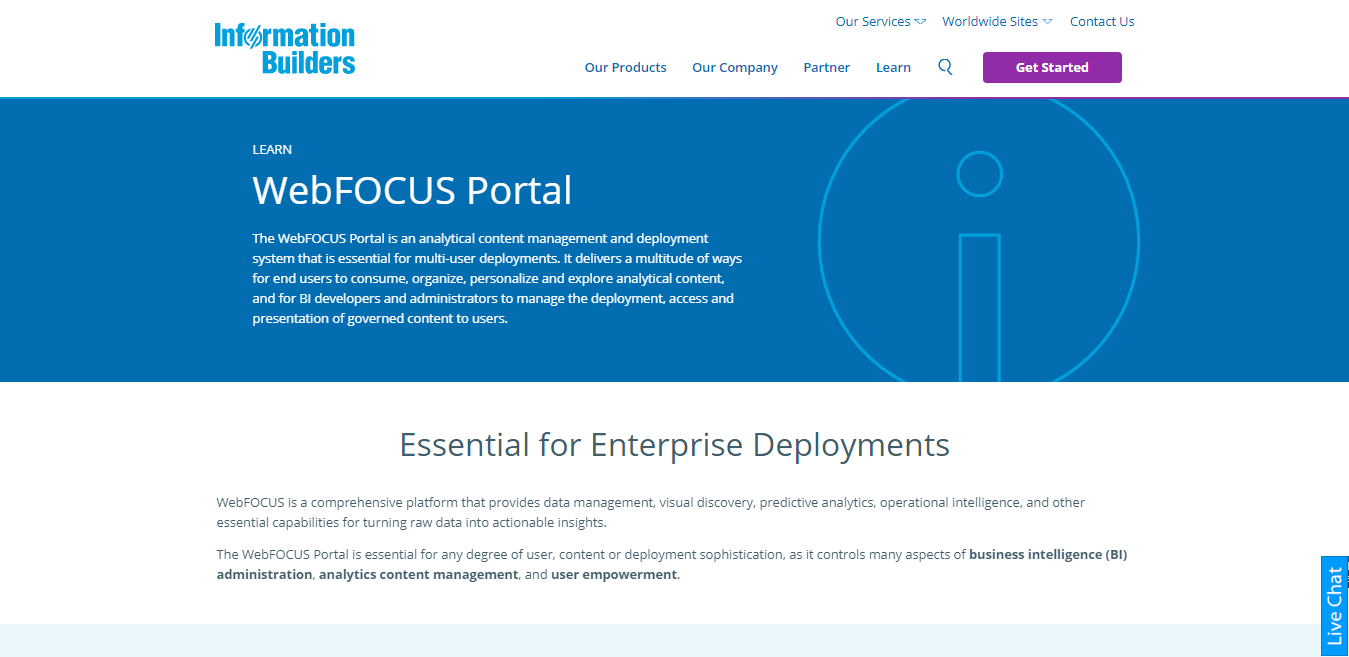
The WebFOCUS portal plays a critical role in enabling the enterprises to manage & deploy an array of governed analytics, crafted for domain users, which can organize & personalize some of the critical pieces of content to drive smarter data-driven decisions within an organization.
The WebFOCUS is an online content management & deployment system, designed to deliver multiple ways for users to consume, organize, personalize & explore the analytical content. The tool is beneficial for BI developers as it allows them to manage the deployment of specific pieces of content required for the end-users by providing them the required access for essential modifications & scheduling.
The important ways in which WebFOCUS assists administrators of enterprise analytics are as under:
- It provides the enterprises with administrative templates designed to create resources, groups & roles as per the guidelines mentioned in the predefined security policies
- It facilitates enterprise-level security required for internal, SaaS & other deployments facing the end customers
- It allows enterprises to create multiple domains as well as portals to segment the user groups, pieces of content as well as the contexts
- For the deployments outside the firewall (e.g., customer-facing) multi-tenancy & the SaaS access management platforms are available
- The portal has been specifically designed to manage the workflow & content delivery for external applications such as the embedding of analytics with an end-user facing system & for application development
- Eliminating the time-consuming custom coding process, the tool can be used by the BI professionals as well as the business users to rapidly create BI portals & interactive pages with interactive pages
- The tool also provides a visual platform for dropping pieces of content into screen containers which might include reports, harts, maps, or even controls. The content can be left to stand alone in the portal or can even be integrated with third-party applications as & when required
- The tool simplifies authoring & can be used for creating & managing predictive content which is responsive & optimal enough to be utilized by the technical & non-technical groups alike
- The analytical pieces of content are managed at one location & the resources from unique users are managed in separate secure repositories
- It assimilates the point-to-click analytics & also includes a host of other popular applications like InfoDiscovery, RSat & ReportCaster
- It provides the users with a collaborative platform to create, publish, share, access & comment on analytics within their domain
5) IBM Cognos Analytics:
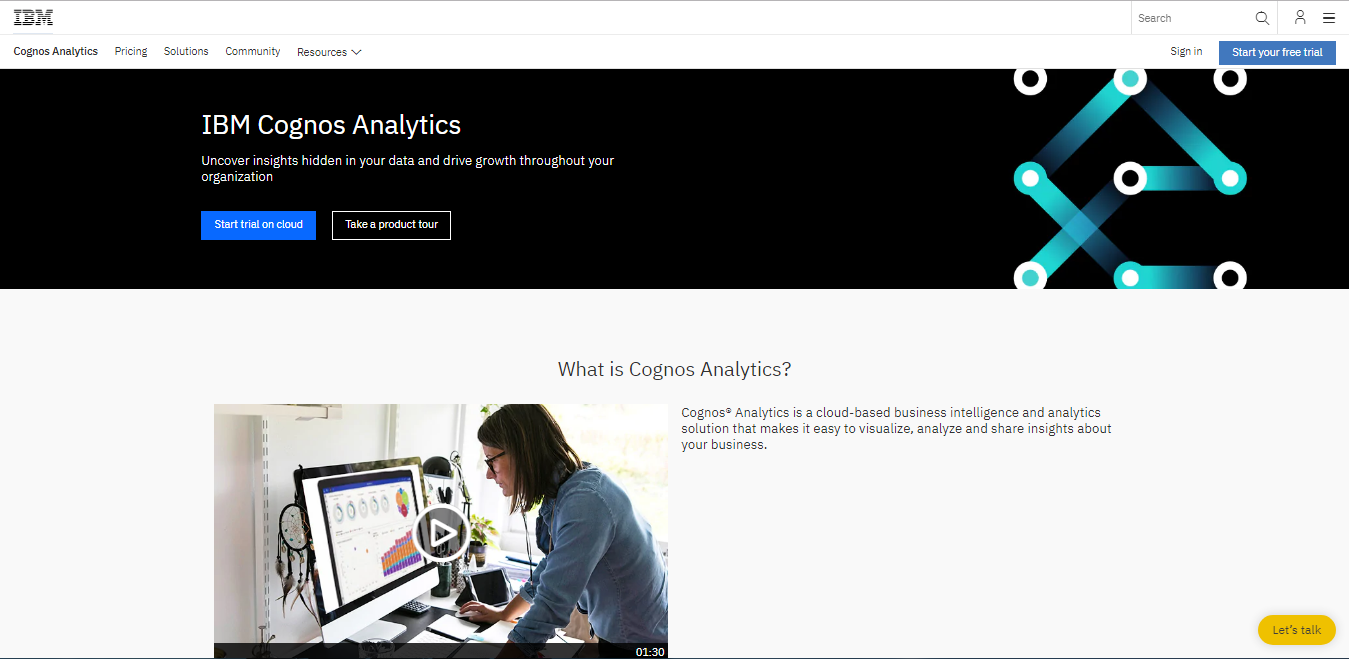
Cognos Analytics is a cloud-based BI & analytics solution that facilitates data analysis & visualization for the end-users. It has the following main features:
- It Allows Visualization of Business Performances:
The tool allows marketers to visualize their business performances with the help of beautiful dashboards & reports generated based on AI recommendations.
- It allows businesses to discover the factors driving their performance:
By the use of plain language, visual exploitation & machine learning algorithms, the businesses can unveil insights about their data.
- It allows marketers to share business insights with their teams:
The platform allows an organization to drive change with the help of interactive & animated data stories.
- It allows the creation of reports with perfect resolution:
The platform allows users to schedule & distribute their reports across thousands of people.
- It serves as a platform for preparation & sharing of data:
The platform allows the marketers to clean, join & share data with the help of in-built automation platforms.
- The platform facilitates data protection:
The tool allows control access for the data with role-based governance as well as on single sign-on.
- Optimizes sales performance, supply chain management & improves users' experiences (UX):
Several companies across the globe advocate IBM Cognos for optimizing their sales performances, improving & optimizing their logistics & supply chain management pipelines & for improving the users' experiences (UX) across omnichannel marketing platforms
-
- It allows users to explore different dashboards & reporting formats by type, day, hours & month
- It allows users to compare sensor readings
- The features for geographical mapping, blending of diverse data sources & exporting tables & charts to PDF or Excel spreadsheets are in-built
- It is an open-source commercial tool that mainly focuses on making accurate & data-driven business decisions
- The tool supports cloud & provides an interactive analytical platform
- The tool is well-known for its rich navigation feature & as an impactful platform for data visualization
- The platform comprises a platform for big data integration, data mining, & predictive analytics tools
- The tool allows the users to connect with data sources across omnichannel & also helps to mine big data to generate meaningful insights tool allows the users to connect with data sources across omnichannel & also helps to mine big data to generate meaningful insights
6) MicroStrategy:
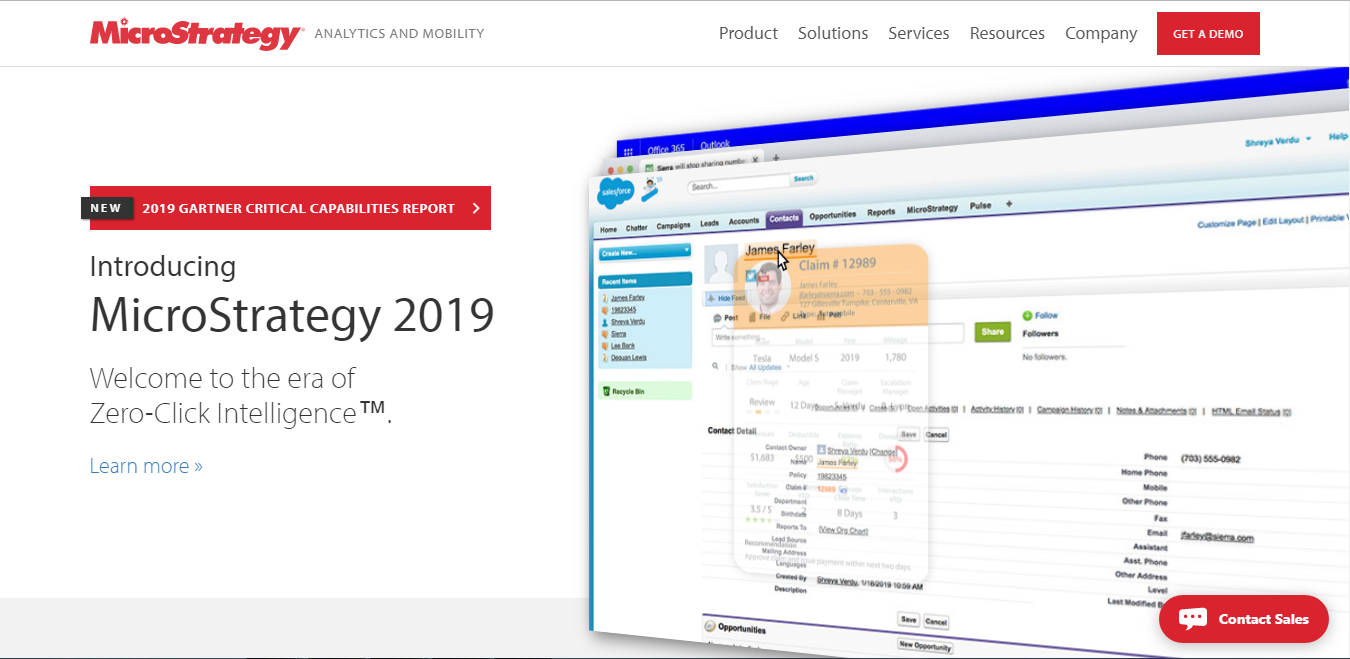
MicroStrategy 2019, which is the upgraded version of MicroStrategy is the world's first & only platform that facilitates HyperIntelligence, coalesced analytics alongside transformational mobility. This holistic tool strengthens the data analytics platform for organizations.
The key features of the tool are as under:
- MicroStrategy serves as a tool for data mining, visualization & its web-based development & allows the companies to make data-driven decisions promptly
- It comprises of multiple features & functionalities that allow organizations to transform information in the form of relevant & eye-catching reports
- The tool enhances the cost-efficiency & productivity of the businesses & facilitates cloud support for them via Amazon & Web Services
- The desktop version of this tool is available free of cost while the enterprise version is priced for cloud-based deployment
7) Pentaho by Hitachi:
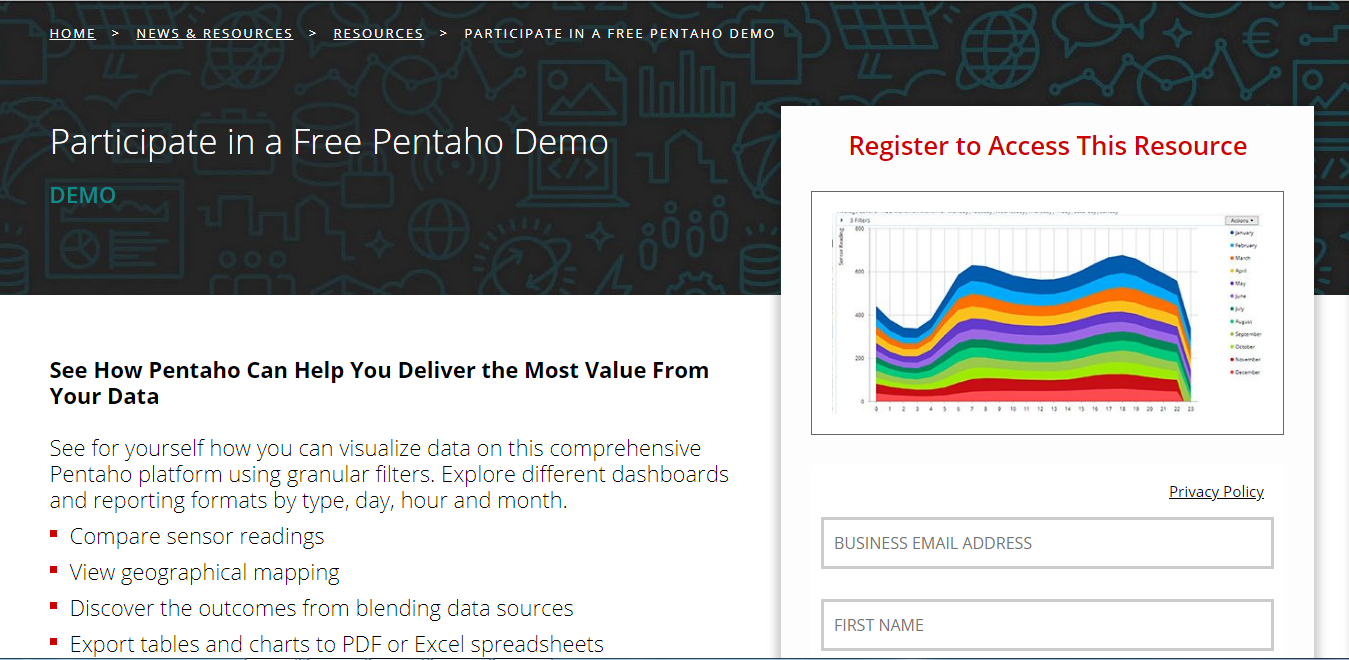
Data can be visualized on a comprehensive Pentaho platform using granular filters.
The key features of the tool are as under:
Data can be visualized on a comprehensive Pentaho platform using granular filters.
The key features of the tool are as under:
- It allows users to explore different dashboards & reporting formats by type, day, hours & month
- It allows users to compare sensor readings
- The features for geographical mapping, blending of diverse data sources & exporting tables & charts to PDF or Excel spreadsheets are in-built
- It is an open-source commercial tool that mainly focuses on making accurate & data-driven business decisions
- The tool supports cloud & provides an interactive analytical platform
- The tool is well-known for its rich navigation feature & as an impactful platform for data visualization
- The platform comprises a platform for big data integration, data mining, & predictive analytics tools
- The tool allows the users to connect with data sources across omnichannel & also helps to mine big data to generate meaningful insights
-
- 8) Microsoft BI and Power BI:
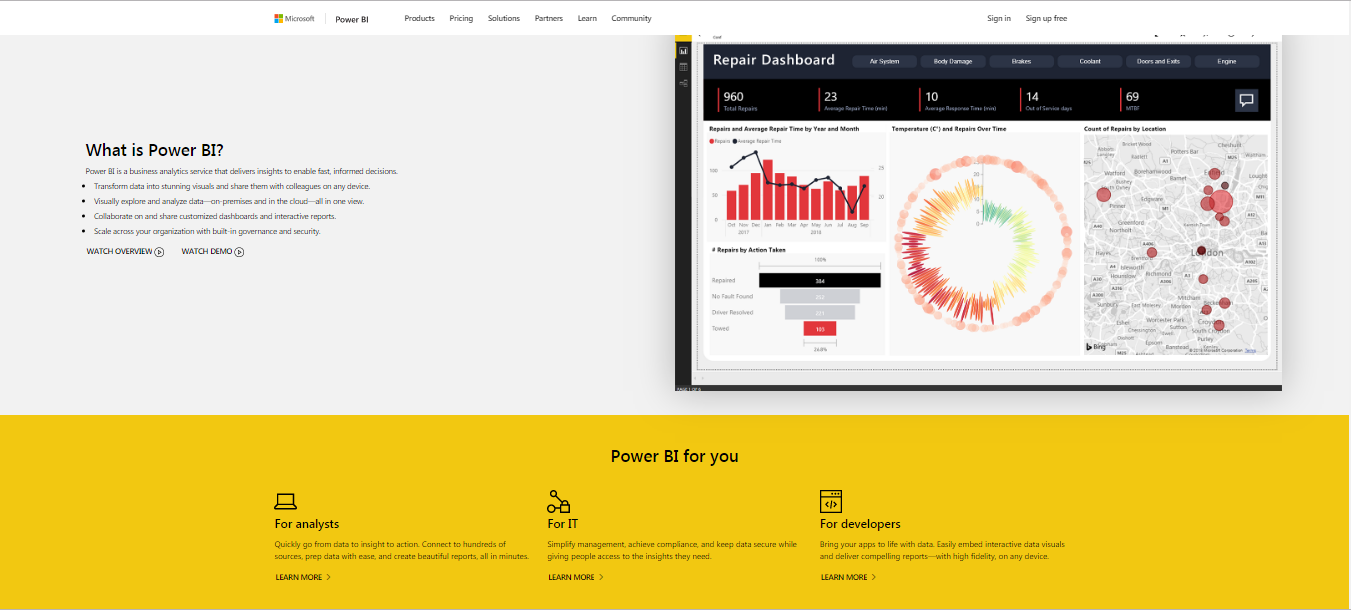
For 12 years consecutively, Gartner has awarded Microsoft a leader in analytics & business intelligence.
The BI tools from Microsoft are a comprehensive solution to a wide array of problems of the enterprises across the globe & provide organizations with a holistic vision about their products, positive sales experience & intuitive user experiences in conjunction with high levels of customer satisfaction. All these parameters have helped in establishing Microsoft as a leader in the Magic Quadrant survey carried out by Gartner which encompassed several globally recognized analytical & BI platforms.
The characteristic features of these BI tools are as under:
- Microsoft BI: It is a propriety platform that provides Integration Services & analyzes data for facilitating the data-driven-decision-making process
- This is a well-known platform for data analysis, reporting & master data services
- Some of the BI tools available in Sharepoint include PowerPivot & Power View
- Reporting Services provide interactive reports that are showcased using the PowerPivot functionality
- Power BI: It is a free open-source business intelligence platform which transforms data collected into diverse visual formats for better understanding
- This platform is also used both for visualization as well as reporting of data-driven insights
- The platform is comprised of the following three components:
- Dataset: It is used to bring all the data from the omnichannel marketing endeavors at one platform
- Dashboard: It is created to represent visual data analytics &
Report: This entails several pages of visualization with organized data analytics in the form of charts & graphs
9) Oracle BI (OBIEE+ and Endeca):
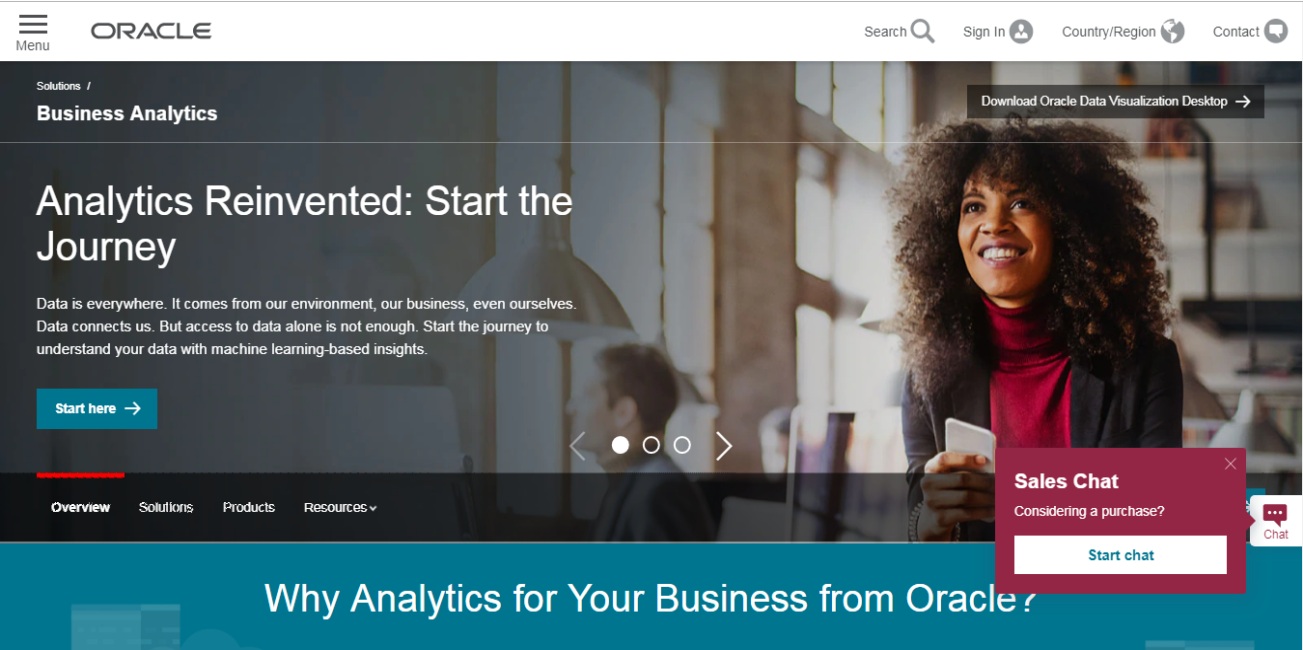
Oracle Analytics is a comprehensive solution to cover all the analytical needs of an organization. The platform helps in processing the aptest data points for the right set of people & delivers the insights at the right time to help the organizations make data-driven business decisions. The hybrid cloud environment can be amended to best suit the needs of an organization & allows the sharing of data amongst various internal departments, including the marketing & sales teams.
The key features of the Oracle Analytical platforms are as follows:
- They facilitate Business Scenario Modeling for "what if" analysis
- They augment Mobile Capabilities with real-time notifications, having access to voice notes
- They serve as an impactful platform for Enterprise Reporting - to schedule & mass produce reports in real-time
- OBIEE is an open-source, copyrighted BI tool to facilitate report generation, Adhoc Query Analysis, Online Analytical processing, etc.
- All the business analytics, definitions, & calculations are framed within a common Enterprise Information structure
- It is well known for providing holistic insights, leveraging in-depth & precise analytics
- The tool serves as a comprehensive solution for data mining, interpretation & analytics, leveraging an agile platform & also assists in the interdepartmental collaboration – particularly those between the marketing, sales & IT departments
- It helps in processing both the structured & unstructured data as well as with the analysis & access of both the traditional & non-traditional data
- It helps the organizations make real-time data-driven decisions by keeping a track record of various advertising spends on marketing endeavors & comparing them with the total organizational expenditures
10) SAP Analytics Cloud:
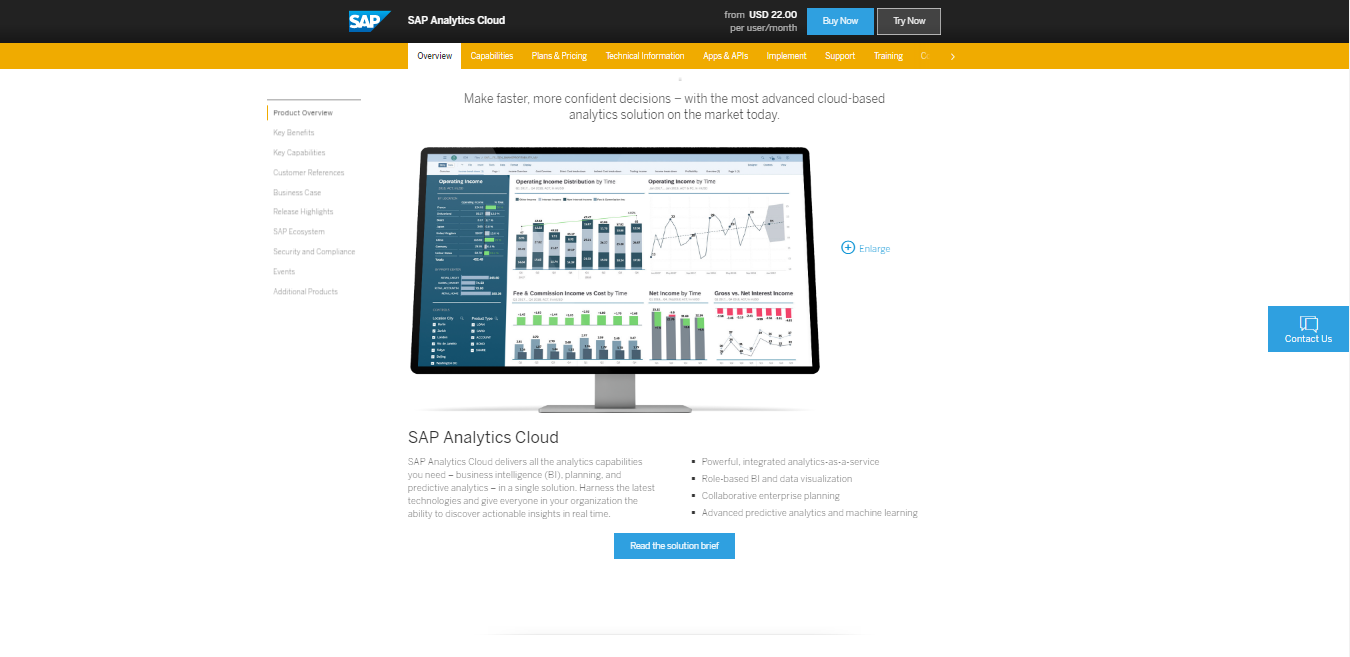
SAP Analytics Cloud provides a 360 degree analytical capacity for the organizations. It acts as a singular & all-encompassing platform for business intelligence (BI), planning as well as for the predictive analytics & modeling.
The other key features of the tool are enlisted as under:
- It empowers everyone within an organization to discover actionable insights in real-time by using the latest agile technologies
- It provides a powerful analytical platform (analytics-as-a-service) which can further be combined with third-party analytical tools
- It facilitates collaborative enterprise planning & reporting
- It facilitates an advanced platform for predictive analytics by using machine learning algorithms
- It provides a common platform for cross-functionality between the internal teams including marketing, sales as well as Information Technology (IT) departments
- Bridging the gaps between the endeavors of marketing, sales & other departments & integrating their efforts ensures that the departments no longer work in silos & a collaborative endeavor paves the way for the revenue optimization for organizations, at large
11) Qlick & QlikSense:
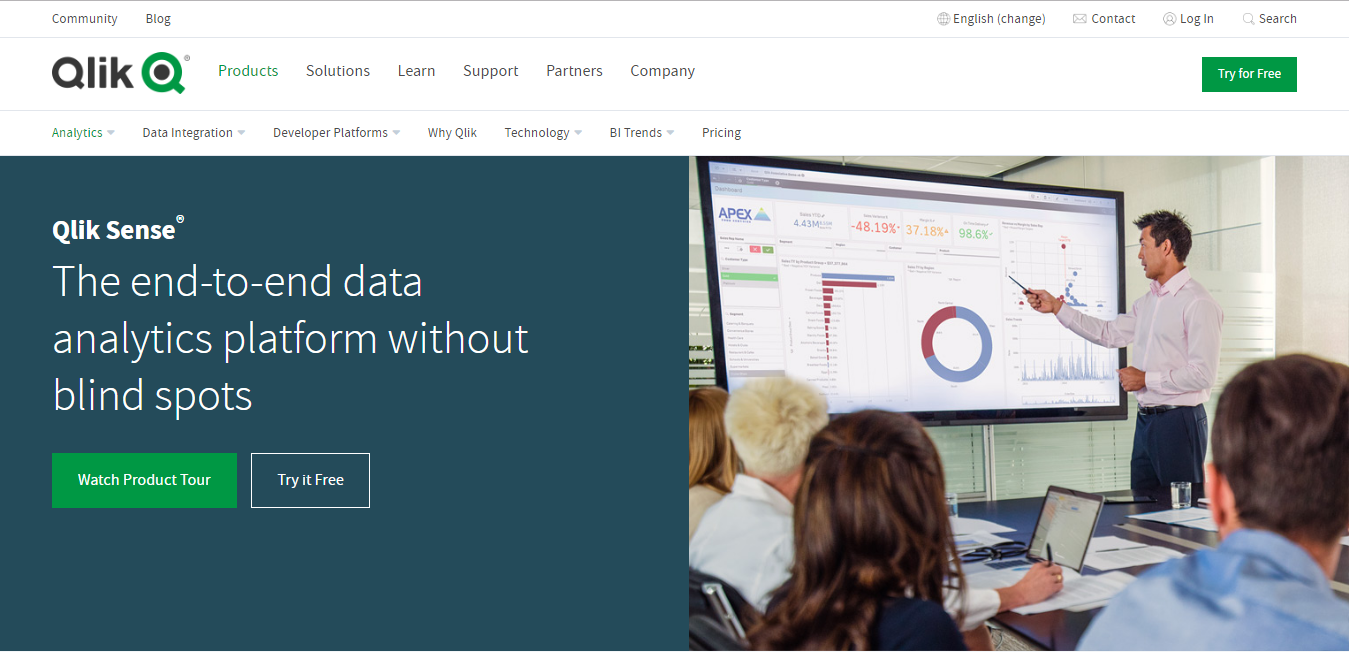
Qlik Sense helps to unveil the data insights that query-based Business Intelligence (BI) tools might miss altogether. It has the following demarcating features:
- It has a unique Associative Engine to bring together all the data which in turn facilitates the users to freely search & explore new insights by analyzing data from multiple sources to drive – data-driven decision making
- The cognitive abilities of the tools utilize artificial intelligence & based on the machine learning algorithms help the organizations with insightful suggestions to be incorporated in their marketing & sales endeavors
- Utilizing Artificial Intelligence (AI) & cognitive capabilities the tool facilitates conversational interaction that driven data literacy about how to mine & process the data for actionable insights
- The multi-hybrid-cloud platform offers a host of deployment choices, including SaaS & also supports a complete range of BI use cases
- It allows an easy combination to multiple data sources, irrespective of their complexity or size, & generates a single view
- The Associative Engine indexes & understands the relationships between all the values in the data – whether related or otherwise
- Being able to establish correlations between diverse data points is imperative for organizations to drive the data-driven decision-making process
- The pre-aggregation of data models & predefined queries to limit discovery are absent altogether
- Anyone can delve deeper into the ocean of diverse data points & using an agile platform can easily derive insights about critical points - by harnessing trend mining & scrutinizing data for a while for actionable insights, following the trend analysis
- It provides a platform for interactive analytics with seamless boundaries & serves as a platform for exploring data on any device (viz. desktop, mobile or tablet)
- It has a cloud and a desktop version as well as an enterprise version which have been specifically designed to get in touch with the sales teams
12) Tableau :
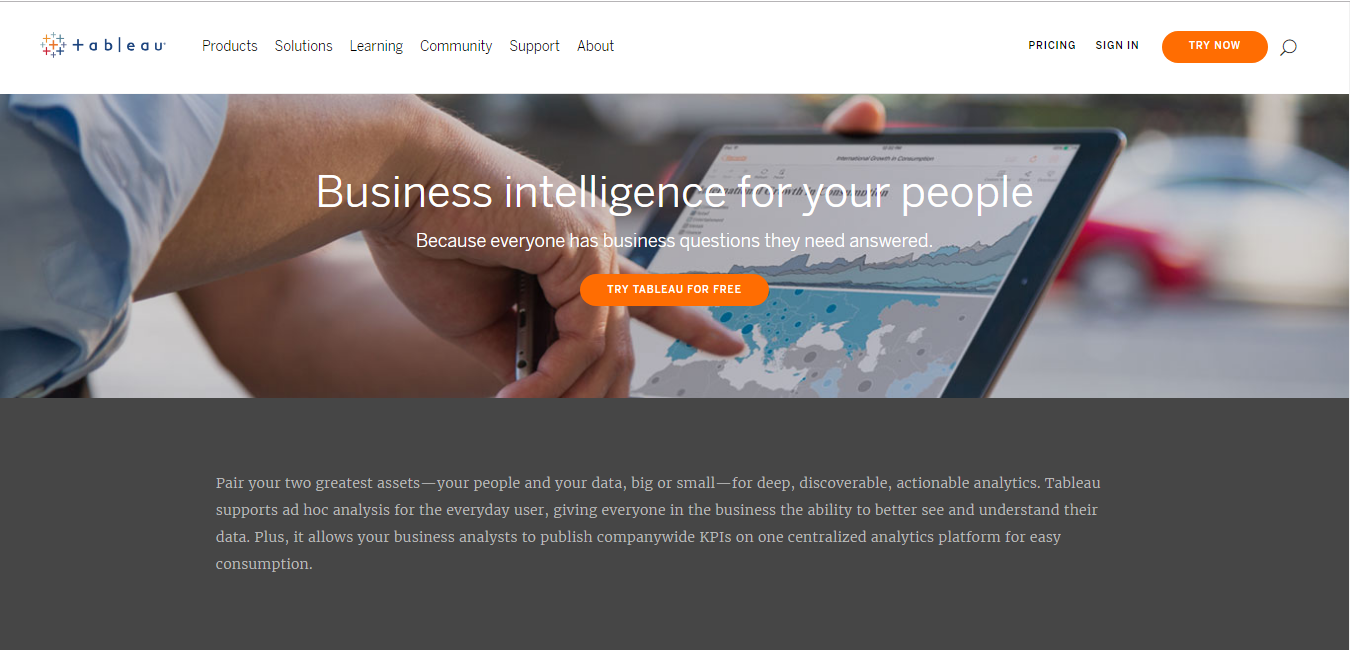
Tableau allows precise, discoverable & actionable analytical insights. The platform supports ad hoc analysis for daily users, allows businesses to better visualize data by creating personalized dashboards to tell several stories, highlighting the most relevant & desirable data points. The tool is considered one of the best in the industry for data visualization & reporting & enables the organizations to make hassle-free data-driven decisions.
The main features of the tool are entailed as under:
- The tool is easy to understand & use & because of a friendly user-interface it can be easily used by the technical & the non-technical people
- The tool allows hassle-free data exploitation, visualization as well as an in-memory architecture in place
- Users can access data from multiple sources & can process them with ease
- The tool integrates Microsoft SharePoint & also serves as a platform for mobile BI
- One-click rapid reporting happens to be the most imperious feature of the tool
13) Board:
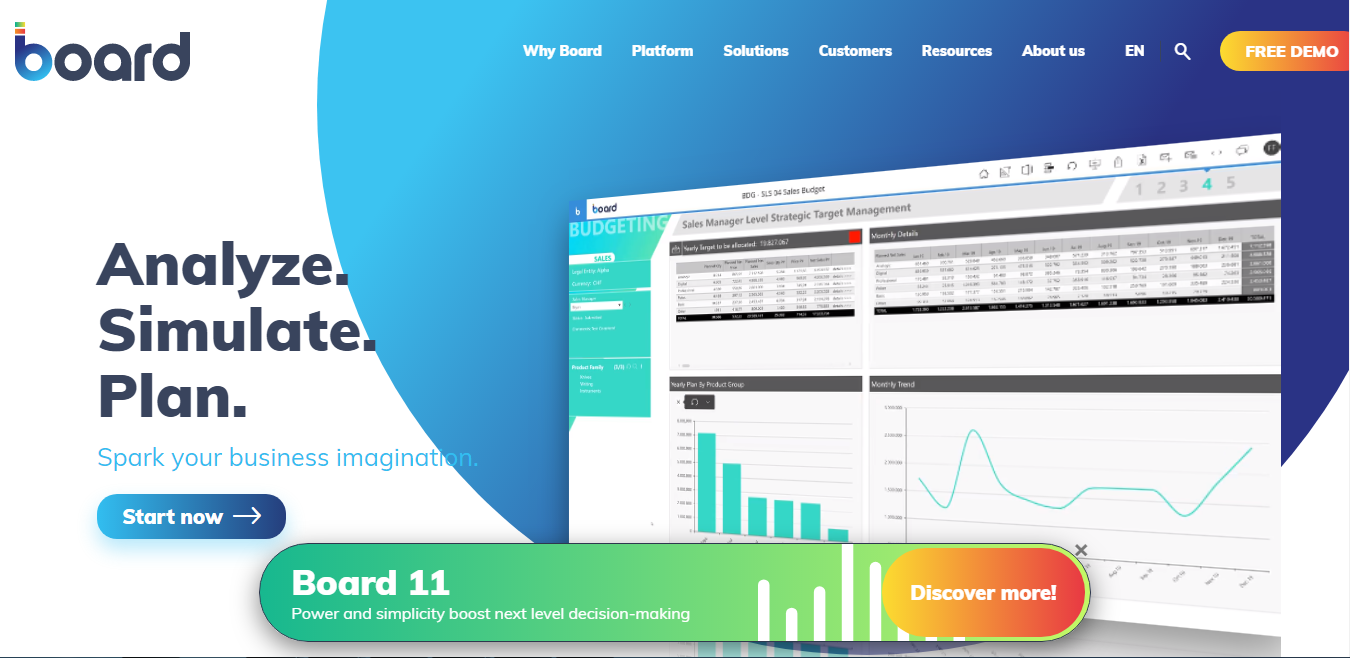
Board boasts to be the most impactful decision-making platform that allows businesses to plan & execute several programs to optimize their revenues by data-driven decision making. The comprehensive tool is capable of helping organizations drive digital transformation within their architectural framework. Some of the key features of the tool are as under:
- It acts as a comprehensive tool for business intelligence & allows the end-users to explore, test-run & analyze & shape their data in the form of interactive dashboards
- The critical data about the businesses can be combined with an enterprise-wide platform for data governance
- It serves as a tool for performance management & links the insights provided by business intelligence to the planning & control cycles of the enterprise
- The tool also facilitates easy implementation of planning solutions, allows profitability applications & effectively aligns the business insights obtained with the corporate strategic objectives of an organization
- The tool allows incorporation of advanced analytics to help organizations build sophisticated platforms for data mining, analysis & predictive modeling
- The tool helps in connecting the most relevant data points to highlight the most relevant business trends & eventually help the organizations in optimizing their sales revenues - by making clever precognitive business decisions, leveraging data-driven decision making
- The tool helps in adopting a comprehensive approach for segmenting data by department, industry or application & thus, allows the organizations to leap their endeavors with data analysis – by providing them with desirable ready-to-use insights
- The data processing features of the tool include features like data visualization, drilling down into the data sets using drill-through functionality
- Besides, the tool also serves as a platform for ad-hoc querying & multi-dimensional analysis of data to help the organizations make stronger & more insightful business decisions
14) Sisense:
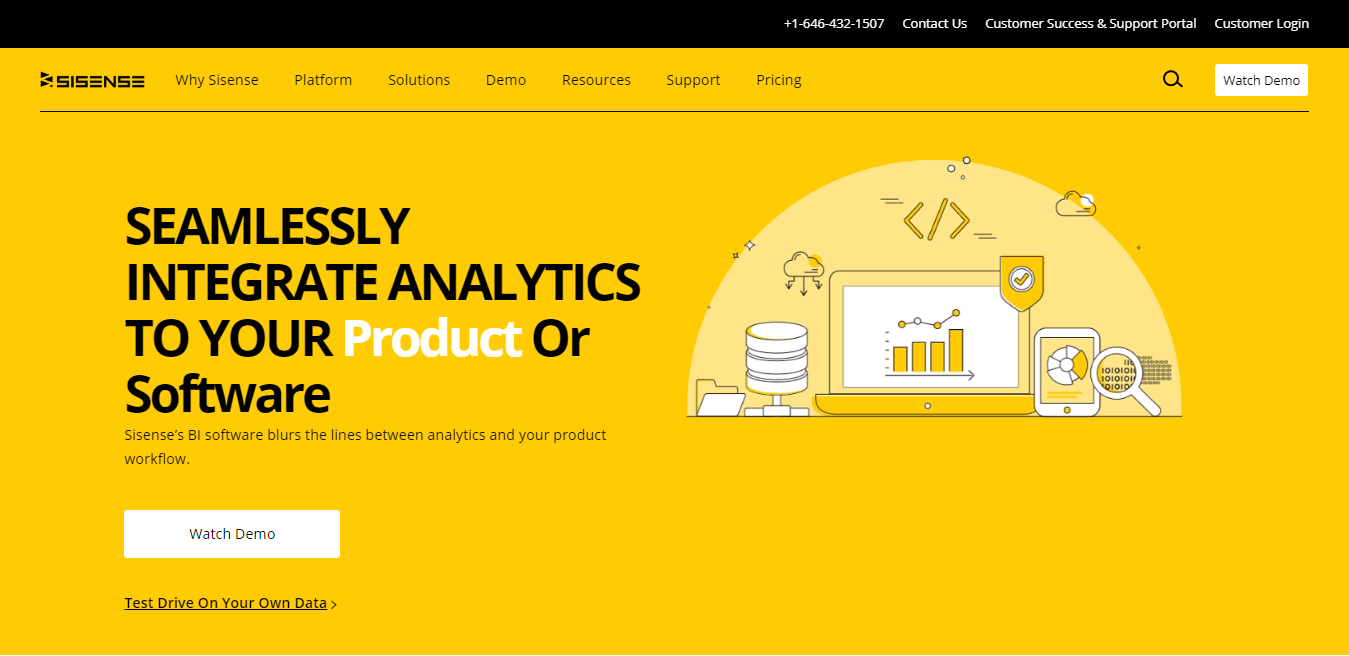
Sisense allows seamlessly integrating analysis with a product or a software solution being provided by an enterprise. The tool allows simultaneous product workflow along with data analytics.
The main features of the tool are as under:
- It has an embedded platform for data-analysis
- It allows business executives to utilize next-generation analytics platform to grow their businesses
- The embedded analytics allows product leaders to compare & choose from a wide range of available choices
- Leveraging robust analytical offerings the businesses can expedite the research process & shift focus to their core objectives such as sales optimization
- The tool is highly scalable as it allows organizations to optimize & balance a large number of queries simultaneously by establishing synchronicity between databases, sources of data & the end-users
- The BI tool is quite flexible & can be easily integrated with customers’ interface & allows the scope of branding through highly customizable front-end using simple Javascript framework, iFrames, or JAQL
- The tool allows secure processing & storage of data by integrating the existing authentication mechanisms within an organization with fine-grain control to assure secured access at the system, object, & data levels
- This tool has a simpler User interface (UI) & can easily be used by amateurish people who aren’t much used to Business Intelligence (BI)
- The solution comes with mobile & web-based deployment & benchmarking
- ElastiCube is used by Sisense as its prime analytics database that is built on In-Chip technology & also supports a hybrid-cloud platform
- Analysis & insights about the Key Performance Indicators (KPIs) of an organization, Profitability Analysis & Strategic Planning, happen to be additional advantages that come with Sisense
15) Adaptive Insights:
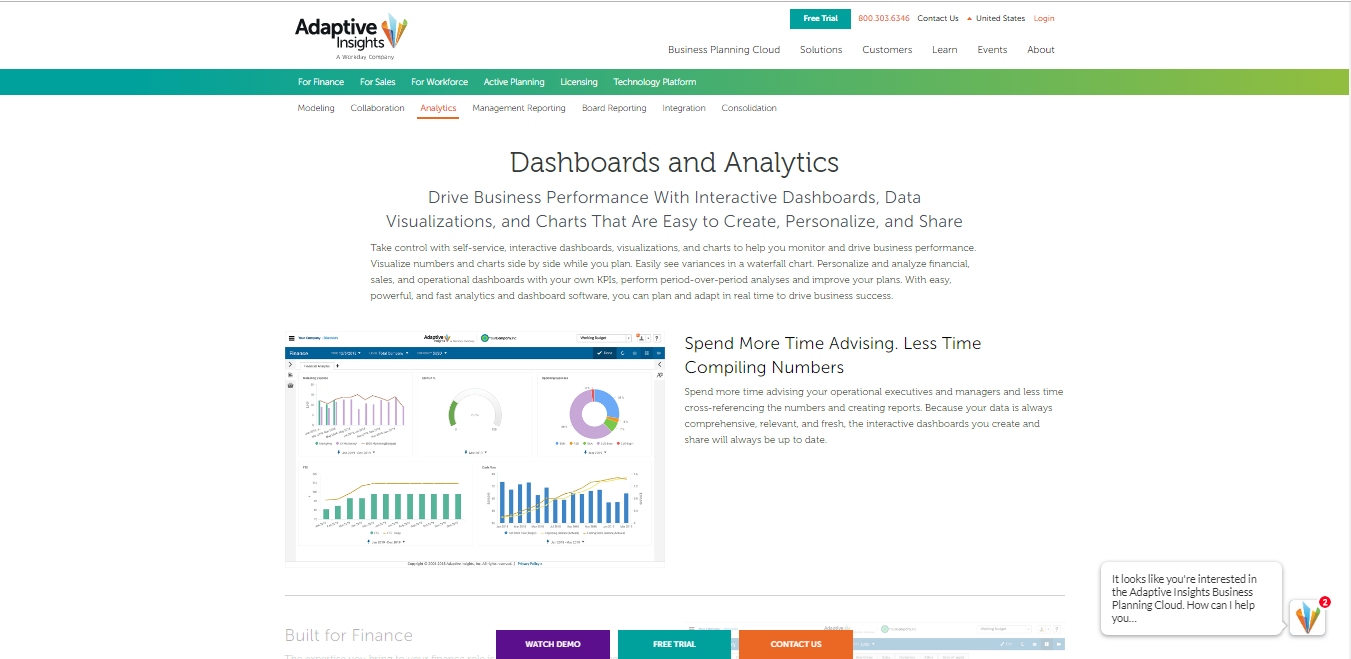
Adaptive Insights is a business intelligence tool that has been specifically designed to incorporate business intelligence & financial analytics together. Working in Finance involves working with several sheets of data as a part of the daily core. The tool is also a useful one for data visualization.
The main features of the tool are as under:
- It gives the non-finance partners the ability to understand Key Performance Indicators (KPIs) & financial data analytics
- The platform is a useful one for comparing the results over a while
- The tool allows spending more time discussing performance & results instead of figuring out the focus areas
- The tool allows the drilling down of visual charts & graphs to access & modify the underlying data sets
- Any graphs or charts that have been created using a specific data point can be viewed in appealing ways using the beautiful dashboards prepared by the platform
- Connecting the dots with the help of visual data shown in a dashboard can help the marketers in creating an impactful story with the help of business data
- The tool serves as an excellent platform to allow businesses to incorporate analytics into the process of financial planning
- Impactful visuals for every probabilistic business situations can be created & the marketers can do their precognitive "what-if" plannings
- The tool allows marketers to make smarter & faster business decisions
16) Jaspersoft:
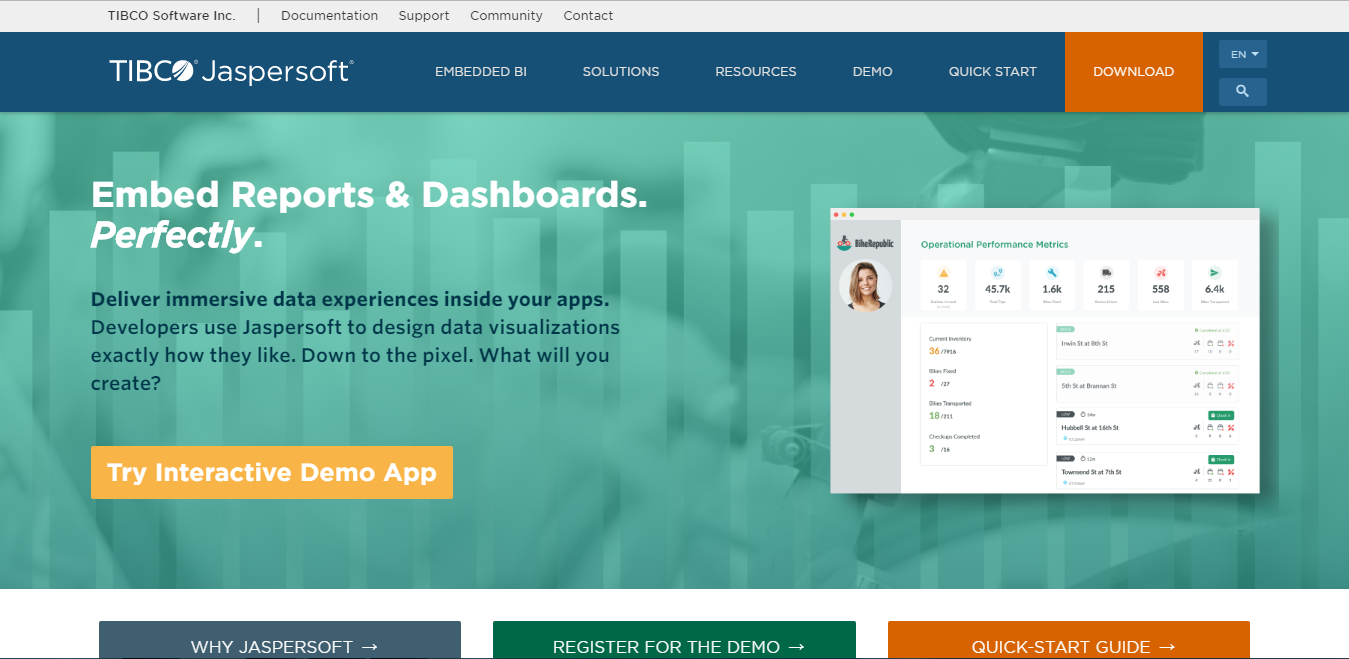
Jaspersoft is an open-source BI tool with in-built analytics & reporting software which is used by developers to design data visualization platforms. The tool allows marketers to competitively benchmark their competitors.
The other demarketing features of the tool can be summarized as under:
- The tool has been designed to give the end-users answers from their data points by increasing the relevance with the data narratives to increase satisfaction & make the products more competitive (by competitively benchmarking it against the core competitors in the market)
- The tool acts as an agile platform for generating the desirable reports for the end-users
- The users can themselves design the visual architecture of their data, which happens to be a unique feature of the tool
- The tool comprehensively handles analytics & allows developers the liberty to focus on their core product
- The tool improves the efficiency of the business model developers by soling taking-over the task of data analysis & its representation in a visual form.
- The tool can be combined with several apps (including the mobile apps) which in turn, can use the analytical insights generated by the app
- The tool acts as a comprehensive platform for data reporting, visualization & integration
- The tool provides support for the decision-making process through Key Performance indicators (KPIs) & problem indicator metrics
- The tool is also available as a SaaS, on-premise & cloud platform
17) Dundas BI:
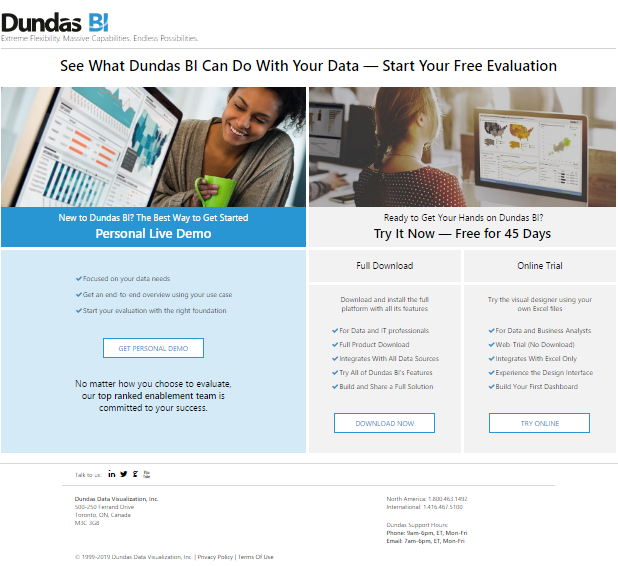
This Business Intelligence Platform is meant for enterprises & is used for building & viewing interactive dashboards, reports, scorecards & much more. The tool can also be deployed as a central data portal for the organizations & can also be integrated with an existing website as a custom BI solution.
Following are the delineating features of the tool:
- The tool can be easily accessed through the web browser
- It allows the use of sample data from Excel sheets
- The tool can be integrated with server applications with full functionality
- The tool can be integrated with several integrated & all-encompassing data sources
- The BI platform has ad-hoc reporting tools
- The tool facilitates a customizable data visualization platform for the end-users
- The tool has advanced drag & drop functionalities
- The tool allows data visualization through maps
- The tool allows predictive modeling of trends & also serves as a platform for advanced analytics
18) InetSoft:
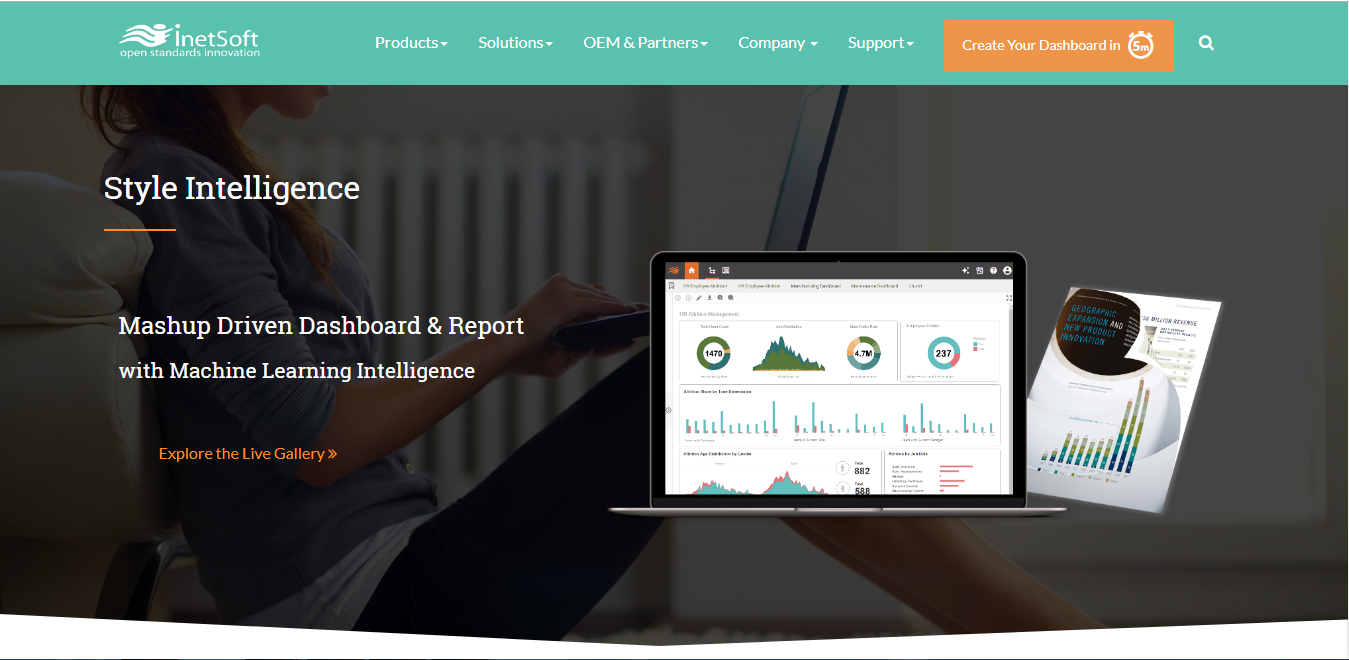
InetSoft facilitates data coalescence & rapid data preparation. The data stored in the cloud, as well as those on-premises, can be mixed with diverse formats & structures into high-performance & precise data points which can be utilized both by business intelligence (BI) as well as the machine learning-based platforms. Sequential Query Language (SQL) databases, JSON/REST, Google Analytics & Salesforce.om are just a few of the platforms that can be integrated with InetSoft.
The key features of the platform are as under:
- The tool allows iterative data mashup & visualization that are coupled together to allow professional designers to understand, govern & safeguard their knowledge interfaces
- The mashup engine facilitates quick data profiling, verification & visualization
- While framing dashboards for data visualization, the data transformations can also be quickly added for a more efficient visual output
- The tool serves as a platform for self-service of data preparation & mashup
- The tool has visual analytic dashboards that can be quickly built into a web app for delivering important business reports
- Document reporting surpasses the scope of simple dashboard exporting
- The tool provides the scope for self-service analytics & ad-hoc reporting
- The businesses can leverage dashboard interactivity & customization
- The tool acts as a perfect intersection point for integrating human intelligence with Machine Learning (ML) algorithms
- It permits accessing of structured databases & semi-structured sources, on-premise applications
- It allows the creation of customized & secure platforms for data exploration and reporting
- Using the in-built Spark platform in the app, the tool can scale up for large data sets of the users
- With the help of the tool, one can generate reports with embedded business logic & parameterization
19) NetLink:

The Netlink Analytics platform has advanced capabilities including voice processing, e-mail, social media & customer sentiment analysis along with the essential video & image analytical feature. The platform not only helps the organizations in expediting their business results but also helps them in getting maximum benefits from the investments made on the BI & Analytics solutions.
The added important features of the platform are as under:
- It is a leading-edge advanced analytics & cloud-based platform
- It is available along with both private or public cloud options & can be delivered as Software-as-a-service or Platform-as-a-service
- The tool provides the best data visualization platform & serves as a single point for accessing data
- The tool has pretty advanced in-built behavioral, sentiment, speech analytics & analytical models & statistical technics
- Every Key Performance Indicator (KPI) is mapped & integrated with universal business KPIs. A unique mapping structure that ensures alignment of segment KPIs with universal business goals like revenue, optimized conversion rate, customer satisfaction & retention.
- Additionally, the platform is also invisible & unique in delivering:
- Out-of-the-Box dashboards
- Enables rapid customization & visualization of the dashboards across all the mobile devises
- Aligning most of the business objectives of an organization with the vital business KPIs, the platform allows marketers to prioritize their business goals
- The tool connects well with the other data points within a business’s ecosystem & provides powerful quick data
- The tool can provide analytics feedback for existing enterprise systems
- The tool entails in-built Subject Matter Experts’ directory
- The tool allows easy assessment of the big data & also facilitates end-user collaboration
- The agility & the unlimited scalability of the tool are impressive features to bank upon
- The tool allows data scientists to mine important business data & report them in the form of meaningful business insights, which aren’t often accessible to the conventional operational reports & dashboards
- The tool offers high resiliency from changes to underlying systems & provides insightful data as per businesses’ requirements
20) ClicData:
ClicData is a comprehensive Business Intelligence platform that allows data warehousing, processing, management, designing & automation at the same time, besides the dashboard feature.
The characteristic features of this BI tool are as under:
- The tool is a comprehensive business intelligence platform to connect the data from over 250 different sources into a single data warehouse to create beautiful & interactive dashboards that can be automatically shared
- The tool facilitates data sharing, insight generation, delineation of metrics, & reports with groups & individuals
- The tool facilitates importing, connecting & standardizing data into single, powerful, cloud-based data warehouses
- The tool reports progress & performances of the specific projects
- The live alerts can be viewed on the dashboards
The tool serves as a platform for vigorous data manipulation.
21) Profitbase BI:
This BI solution delivers critical business information encompassing data-driven insights & analysis, financial planning & cloud & system development. The key features of the tool are as under:
- The tool integrates data for preparing intuitive dashboards, capable of advanced analytics by leveraging machine learning (ML) based algorithms
- The tool facilitates budgeting & forecasting for financial simulation, loan portfolio & allows the end-users to consolidate & manipulate their content strategies
- The tool serves as a platform for cloud-based deployment & is compatible with diverse devise platforms such as desktop & mobile. Besides, there is also a web version
- The tool can be integrated with Microsoft Azure & allows the scope for customization & manipulation of data
- There are several in-built courses in the BI tool such as Microsoft courses & Power BI Seminars, which simplify the User Interface (UI) for the end-users
- The tool can also be used as a Profitbase software & helps in performance & enterprise management, along with data warehousing, client reporting & planning
- The tool can be deployed for consulting services
- The data on the platform is constantly updated which helps the organizations in making faster business decisions based on continuously updated & accurate data
- It provides exposure to the vital KPIs resonating with finance, sales, AR/AP, as well as performance measures
- It is modular, scalable & consists of a data warehouse augmented with OLAP cubes
- The tool allows adding new business systems through acquisition or system upgrades
- The end users can choose the analytics tools best suited for their requirements
22) Exago:
Exago is amongst the best embedded BI & Analytics platforms available in the market. This comprehensive BI platform allows the technical as well as the non-technical users, the liberty to design & format basic tabular reports.
The additional features of the platform have been entailed as under:
- The tool allows advanced functionalities such as Charts, Formula Editor, & Conditional Formatting & an excel-like design
- It simplifies complex tables by replacing them with summary results
- It provides a wide array of animated visualizations that can choose from a Chart Wizard
- The mapping wizard makes the tool easy for the users to visualize their data on geographical maps
- The BI tools allow users to link an unlimited number of charts & tabular reports
- It automatically merges data to PDF, RTF &Excel templates
- The tool is accessible via a wide array of platforms such as iPad, iPhone & even the android devices
23) Halo:
This powerful tool provides analytics for business users belonging to supply chain analytics platforms designed for business users. It allows both the automated data transformation as well as the manual manipulation of data.
The key features of this tool are as follows:
- It provides a clean & intuitive interface which is helpful for self-service dashboard customization
- The tool facilitates the sharing of data & collaborating several data points for the data-driven decision-making process
- The BI tool can be used sales & operations planning, demand planning, inventory planning, supplier management, custom management, data visualization, reporting & analysis, to meet the unique needs to all the business functions
24) Veera by Rapid Insight:

The easy to use, powerful & affordable business analytics platform allows the end-users to access data & unlocks the critical business insights. Veera is a comprehensive platform for data preparation & analysis. The platform relies on automated modeling to establish relationships within complex data sets.
The key features of the platform are as under:
- The tool serves as an easy & affordable platform for data prep, automated predictive modeling & end-user data exploration
- It allows decentralization of analytics, democratizes data & enables smarter, quicker & relevant data-driven insights across an organization
- The platform helps in building predictive models to analyze the past browsing histories of customers & uses the trends to predict future outcomes
- The tool has a predictive model which automatically mines data, identifies variables with predictive qualities & builds powerful, insightful & transparent predictive models
- The tool serves as a platform for data exploration
- The user interface is perfectly simple & anyone, at any level can explore & analyze data as well as can build dashboards to present their business knowledge in an impactful way
25) Clear Analytics:
Clear Analytics is a BI tool that is highly precise, timely and has a system that delivers clear business insights. The tool fulfills the diverse requirements of a business. It facilitates easy extraction of large volumes of data from diverse sources & helps present it in the form of professional reports.

The other key features of the tool are as under:
- The tool has a simple user interface (UI) & is a powerful business tool using excel
- The tool is fast & relatively easy to use
- It facilitates dashboard creation & helps in sharing the vital data points securely amongst the teams
- The tool can be directly connected with the current Excel environment of an organization & no additional training is required
- Custom queries can be articulated within minutes
- The tool relies on self-service & allows access to data without special help from IT
- Custom queries can be added by dragging & dropping
- The tool maintains governance over data sets, monitors how the data sets are being consumed & provide the infrastructure security required for improving data quality & delivery
- It can easily be integrated with other BI tools such as Microsoft Power BI
Wrapping Up
According to a report by Gartner, throughout the year 2015, 85% of the Fortune 500 organizations were unable to exploit big data for competitive advantage.
The right BI tools can help harness the power of data. Companies dealing with large chunks of data may also want to consider investing in steadfast IT solution suites to supplement the security needs of their companies. Business Intelligence is a self-explanatory term that means improving business performance skillfully & intelligently.
The key purpose of BI tools is to help enterprises expedite their data-driven decision-making process by assimilating insights from diverse sources on a single platform & by allowing the organizations to analyze several data points, simultaneously for deeper perspectives on what is going on with their businesses. The best platforms for business intelligence are subject to constant change as per the need of businesses & as per the dynamically changing technologies.
For the year 2019, however, the above-mentioned BI platforms seem to be the most interesting ones from helping organizations optimize their sales revenues & the Return on their Marketing Investments (ROMI).